At Bucars RV, we’re here to help with all of your RVing needs. From service to sales, and advice on how to make camping memories that will last a lifetime, Bucars RV just north of Calgary has you covered!
To educate you about the latest camping trends, the RV industry, and how people are enjoying their RVs, we’ve created a handy guide that highlights interesting and informative RV statistics for RV owners.
We hope you enjoy this guide, and that it provides some value to help you make some educated decisions about RVing!
Table of Contents
- Camping Behaviour Statistics
- Camping Demographic Statistics
- Camping Trip Statistics
- RV Type Statistics
- RV Industry Statistics
- Alberta RVing Statistics
- BC RVing Statistics
- RV Camping Expenditures
- RV Service Statistics
- RV Lifestyle Statistics
- RV Cost Statistics
- RV Manufacturer Statistics
- Visit Bucars for all your camping needs
Camping Behaviour Statistics
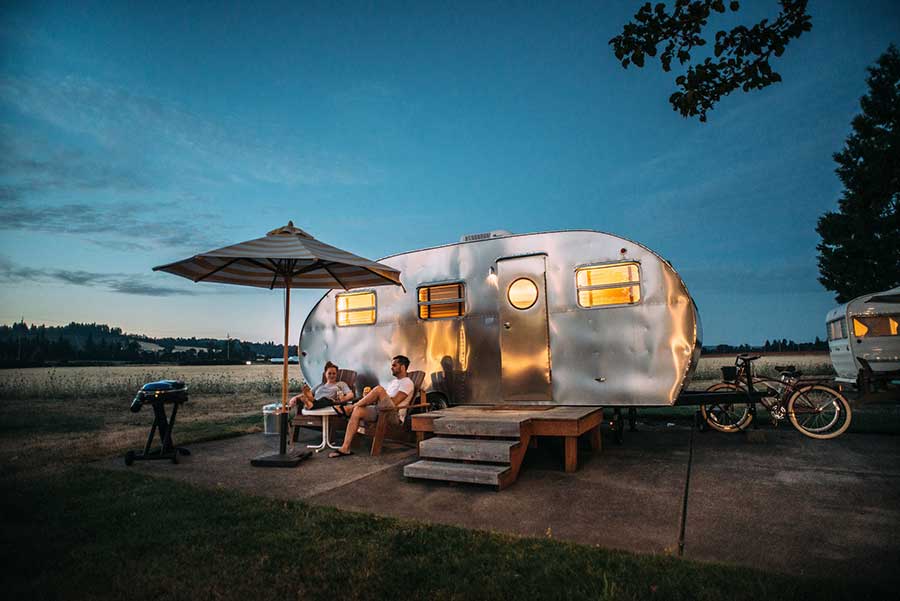
One thing we’ve always found interesting is how differently people enjoy camping. Some camp alone, some take their friends and families on camping trips, and everything in between.
We’ve found some awesome statistics about how often Canadians go camping, what kind of criteria they use to decide where they go camping, what they enjoy doing when they go camping, and who they create camping memories with.
Take a look at the stats below:
How Often Canadians Are Going Camping
Here are some awesome statistics about how often Canadians go camping. It was incredible to hear that most Canadian RV campers go camping at least three times per year! The majority of campers also want to camp more often next year. Who wouldn’t want to get out camping more often if they could?
- 33% of Canadians have been camping their entire lives. (KOA, 2019)
- 5% of Canadians went camping for the first time this year. (KOA, 2019)
- 50% of camping households intend to take more camping trips next year. (KOA, 2019)
- 54% of camping households also intend to take longer camping trips next year. (KOA, 2019)
Criteria Considered When Selecting a Campsite
Here are some interesting stats about how RVers select a spot to go camping. We all camp a little bit differently, it is interesting to see what some people prioritize when picking a campground!
These statistics show that people are picking a spot to camp for the overall experience that the campsite delivers over just the amenities and features. Here’s a list of what people look for in a camping destination:
- The top factor in selecting a campground to camp in be percentage (KOA, 2019)
- 3% selected a campground for the availability of Wi-Fi
- 7% selected a campground because it was pet-friendly
- 24% selected a campground for its atmosphere
- 22% selected a campground for its location
- 18% selected a campground for the quality of the campsites at that particular campground
- 9% selected a campground for the availability of cabins for guests
- 12% selected a campground for the type of sites that are available (power, water, etc.)
- 5% selected a campground for onsite recreation and activities
- Of those that prioritized onsite recreation over other factors in selecting a campground, Gen Xers found it most important with 17% of campers (KOA, 2019)
Camping Activity Statistics
Many campers don’t just camp for the sake of staying in their RV for the entire trip. Campers like going out to do things or use their RVs as a home base for other activities!
Here are some interesting stats about what Canadian campers choose to do while on a camping trip:
- 9 out of 10 campers leave campsites to participate in other activities (KOA, 2019)
- Favourite outdoor recreation activities for campers by percentages (KOA, 2019)
-
- 60% enjoy hiking / backpacking
- 50% enjoy fishing
- 37% enjoy sightseeing
- 38% enjoy canoeing or kayaking
- 32% enjoy visiting historical sites
- 30% enjoy biking
- 28% enjoy bird watching
Who North Americans Are Camping With
Another interesting topic is who campers are choosing to go camping with. Given the stats below, it can be concluded that the vast majority of campers are choosing to go camping with their families.
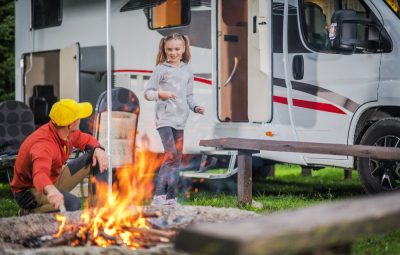
Camping in an RV is a great way to make memories that will last a lifetime with the people that matter the most to you. Regardless of who you choose to go camping with, it’s a great way to spend quality time with your favourite people.
- Who campers are choosing to go camping with by percentage: (KOA, 2019)
- 65% are camping with their spouse or significant other
- 37% are camping with their children
- 8% are camping with their grandchildren
- 13% are camping with their parents
- 3% are camping with their grandparents
- 7% are camping with their friend’s children or grandchildren
- 33% are camping with friends
- 18% are camping with other family members
- 13% are camping with siblings
- 5% are camping with an organized group or another social group
- 2% are camping with individuals that have physical limitations or disabilities
- 6% camped solo at least once over the course of the year.
Camping Demographic Statistics
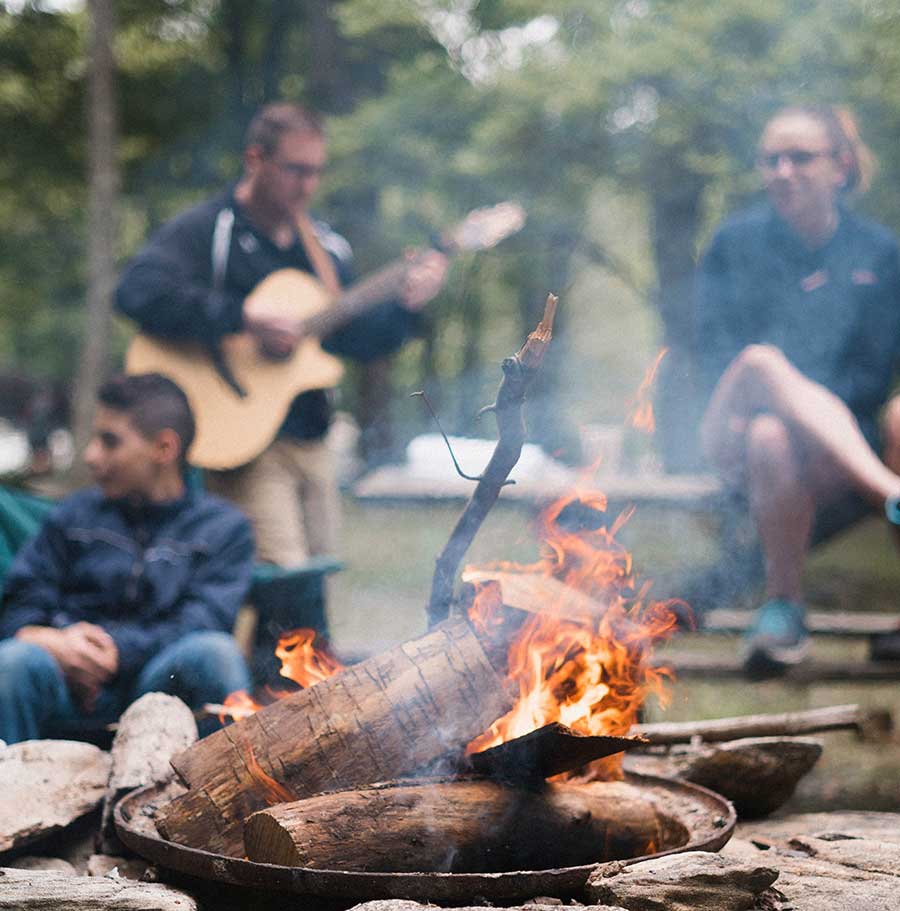
Here are some detailed demographic statistics about North American RV campers! It’s interesting to see who is going camping and get some insight as to what kind of lifestyle they may have.
Stats show that the majority of first time campers were Millennials, nearly half of RV camping households earn $25,000 to $74,999 per year, the number of camping households grew by over a million people in the last year, and the majority of camping households have children.
The stats below are almost everything you could want to know about the people that go camping in North America!
- Of those that went camping for the first time this year (KOA, 2019)
- 56% were Millennials
- 25% were Gen X
- 14% were Baby Boomers
- 4% were Mature (65+)
- Percentage of North American camping households by income (KOA, 2019)
- 19% of camping households earn <$25,000
- 28% of camping households earn $25,000 to $49,000
- 21% of camping households earn $50,000 to $74,999
- 14% of camping households earn $75,000 to $99,999
- 18% of camping households earn $100,000+
- 52% of North American camping households have children (KOA, 2019)
- The typical household income for RV owning households is about $62,000 (The Wandering RV, 2020)
- 60% more households own an RV now compared to 1980 (The Wandering RV, 2020)
Camping Trip Statistics
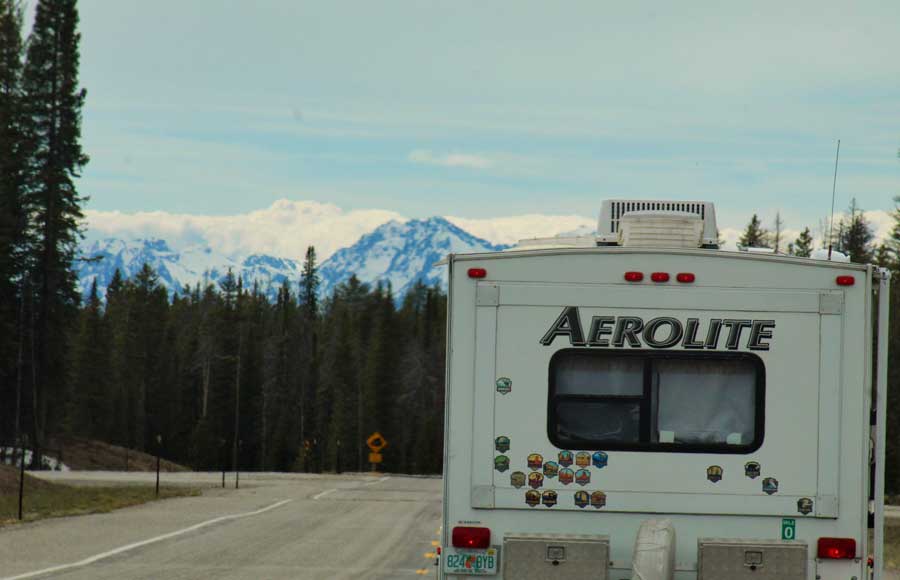
It’s always interesting to see how far people will go for their camping trips and where their camping adventures take them!
Statistics show that nearly a quarter of Canadian RV campers like camping close to home by travelling less than 50 miles for a camping trip, and over a quarter prefer a long haul, travelling over 200 miles for a camping trip. That’s quite the spectrum!
A large number of Canadian campers also love camping in national or provincial campgrounds. Statistically, we really are quite an adventurous bunch when it comes to our RV camping trips! Here are some cool stats about where Canadian campers are going on their camping trips:
- How far campers travelled for camping trips in Canada by percentage (KOA, 2019)
- 24% of campers travelled less than 50 miles for camping trips
- 18% of campers travelled less than 51 – 100 miles for camping trips
- 16% of campers travelled less than 101 – 150 miles for camping trips
- 14% of campers travelled less than 151 – 200 miles for camping trips
- 27% of campers travelled more than 200 miles for camping trips
- The locations and campground type for camping trips by percentage (KOA, 2019)
- 25% camped in privately-owned campgrounds
- 40% camped in national or state / provincial campgrounds
- 8% camped in the backcountry, a national forest, or wilderness area
- 2% camped in parking lots like Walmarts or roadside areas
- 20% camped in privately owned land other than a campground
- 5% camped in a municipal campground or area
RV Type Statistics
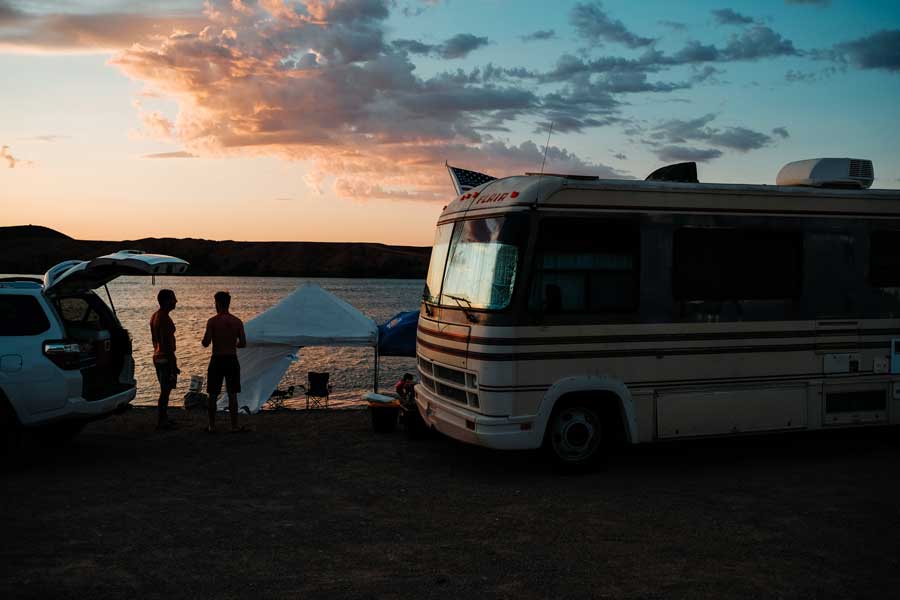
Here are a group of stats that we found really interesting. We do our best to stay on top of the latest camping trends and purchasing habits of Canadian RVers so that we can have the best RV inventory possible. We want to be sure we have the perfect RV in stock for you and your family so you can hit the road and enjoy your next camping adventure.
Although there are a lot of folks out there that camp in a tent, cabin, or something similar, there are still quite a few that love RV camping. Of those that prefer RV camping, motorhomes are the most popular type of RV for Canadian campers.
The preferences seem to differ slightly for Travel Trailers and Fifth Wheels for families of different sizes, but motorhomes still come out on top! If you are looking for any of these RV body types, Bucars RV has you covered! We have plenty of each in stock at our RV dealership just north of Calgary.
- The preferred type of RV for those camping alone by percentage (KOA, 2019)
- 21% prefer Motorhomes
- 13% prefer Travel Trailers
- 10% prefer Fifth Wheel Trailers
- The preferred type of RV for those camping with a partner by percentage (KOA, 2019)
- 25% prefer Motorhomes
- 14% prefer Travel Trailers
- 13% prefer Fifth Wheel Trailers
- The preferred type of RV for those camping with a partner by percentage (KOA, 2019)
- 28% prefer Motorhomes
- 19% prefer Travel Trailers
- 19% prefer Fifth Wheel Trailers
- The preferred type of RV for families by percentage (KOA, 2019)
- 36% prefer Motorhomes
- 25% prefer Travel Trailers
- 24% prefer Fifth Wheel Trailers
RV Industry Statistics
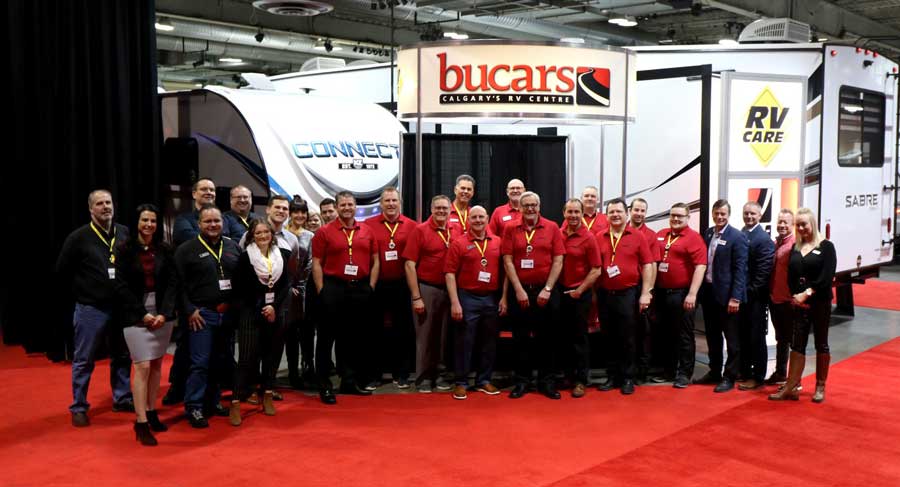
The RV industry is booming! Year after year, the RV industry creates hundreds of jobs for Canadians and contributes a significant amount to the Canadian economy.
This comes from RV manufacturing, sales, service, products, and other expenditures that are directly related to purchasing or owning an RV. Given that RVs are a sizeable investment, the RV industry is also responsible for a number of RV loans from various financial institutions.
We’ve collected a list of stats about the RV industry and its contribution to the Canadian economy. We love being a part of this exciting industry and cannot wait to see what it will become in the future! Here are some RV industry statistics to educate you about the impact the industry has on the economy.
- There was $6 – 8.74 billion CAD in RV Sales from 2013 – 2018 (Statista, 2019)
- $4 billion total revenue in 2019 (IBIS World, 2019)
- The Canadian RV Industry saw an average of 2.7% Annual Growth in revenue from 2014 – 2019 (IBIS World, 2019)
- 6,118 people are employed by the Canadian RV Industry (IBIS World, 2019)
- The RV Industry contributed $1.9 billion in tax revenue to the Canadian economy (CCRV, 2018)
- $470 million CAD in manufacturing sales (CCRV, 2018)
- There were over 1,200 RV dealers in 2016 (CCRV, 2018)
- In Canada, the industry is responsible for over $7 billion in retail sales each year (The Wandering RV, 2020)
- In 2017, the RV Industry celebrated its eight straight year of sales growth. During this 8-year span, the recreational vehicle industry has grown more than 200% (The Wandering RV, 2020)
- Over 200,000 indirect loans were generated at retail locations offering recreational vehicles for sale in 2017. These loans totalled $8.4 billion from households purchasing RV’s (The Wandering RV, 2020)
- Of those 200,000 loans, the average amount financed by a household purchasing an RV is over $45,000 USD (The Wandering RV, 2020)
Canadian RV Manufacturing Statistics
Although many RVs are manufactured elsewhere, there are still a substantial number of RVs and RV related products being manufactured in Canada. The CRVA released a report about the magnitude of impact the Canadian RV Manufacturing industry has on the Canadian economy.
You’ll be happy to know that Canadian RV manufacturing contributes a significant amount to the Canadian economy as well! This industry creates many employment opportunities and a ton of tax revenue for the Canadian economy. Here are some interesting stats about the contributions it makes:
- +$355.3 million in value added to the Canadian economy in 2018 (CRVA, 2018)
- +5,400 full-time years of employment in 2018 (CRVA, 2018)
- +$229.3 million in labor income across Canada in 2018 (CRVA, 2018)
- +$88.7 million in tax revenue to municipal, provincial and national governments in 2018 (CRVA, 2018)
Canadian RV Retail and Service Statistics
One of the other ways the RV industry contributes to the Canadian economy is through retail and service-related expenditures. Even those that do not purchase new RVs every year end up buying RV-related products and servicing their RVs.
Here are some interesting statistics about the contributions made to the Canadian economy by RV retail and service-related expenditures:
- +$681.4 million in value added to the Canadian economy in 2018 (CRVA, 2018)
- +10,300 full-time years of employment in 2018 (CRVA, 2018)
- +432.0 million in labor income across Canada in 2018 (CRVA, 2018)
- +$149.3 million in tax revenue to municipal, provincial and national governments in 2018 (CRVA, 2018)
Alberta RV Camping Statistics
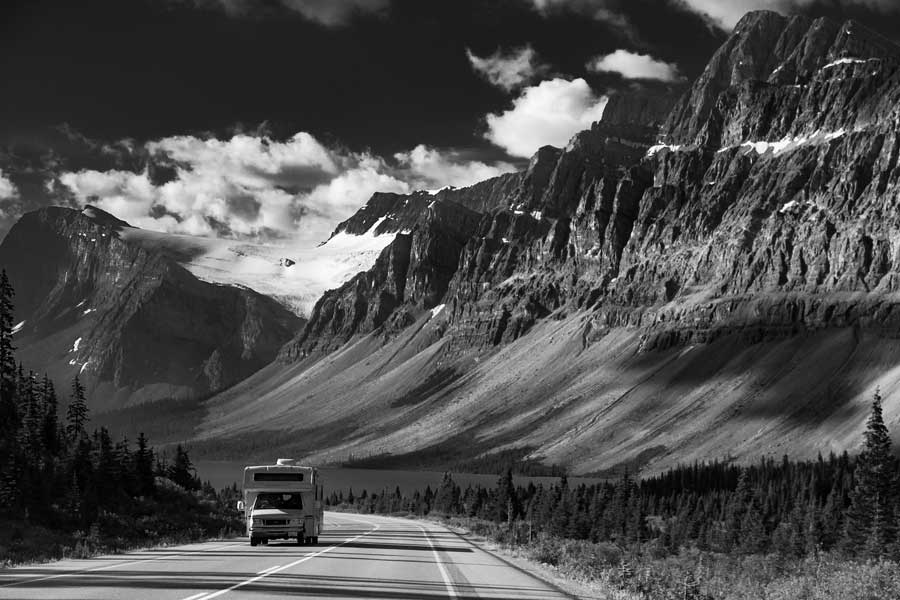
Here are some interesting statistics about camping in Alberta and the campers within our wonderful province.
It’s fascinating to see what tendencies RV owners in Alberta have, what kind of camping trips they go on, which RVs they prefer, and a bit more information about the campgrounds available in Alberta.
We love camping in Alberta. It’s what we’re all about! We’re proud to be here to support Albertans and help them get everything they need for their camping adventures.
From new and used RV sales, to parts, service, and even just tips to make your next camping experience the best one yet, Bucars RV dealership is here to help with all of your Alberta RV needs.
Alberta RV Ownership Statistics
Here are some cool Alberta RV ownership statistics! Did you know our province, although smaller than some of the other Canadian provinces, accounts for nearly a quarter of Canadian RV sales? That’s a pretty impressive figure!
It’s no secret that Albertans love camping. Given the stats below, it seems that they enjoy camping in Travel trailers the most. Even cooler, 19% of households in Alberta own RVs. Here are some stats about RV ownership in Alberta:
- RV ownership is highest in Alberta and Saskatchewan compared to other provinces with 19% of households owning an RV (RVDA, 2018)
- Alberta accounts for 23% of new Canadian RV sales (RVDA, 2018)
- 22% of RVs in Alberta are Fifth Wheels (Praxis, 2009)
- 34% of RVs in Alberta are Travel Trailers (Praxis, 2009)
- 15% of RVs in Alberta are Motorhomes (Praxis, 2009)
Alberta RV Camping Trip Statistics
Now that we’ve established that many Albertans own RVs, how often do they use them? It turns out, quite a bit! The average RV owning household makes 3-4 trips per year. It seems like a lot of Albertans are long weekend warriors!
Albertans make over a million camping trips annually, and they normally camp in a provincial park. It’s one of their favourite leisurely activities! Here are some more cool stats about how often Albertans are camping and where they’re going for their camping trips:
- The average Canadian RV owning household camped for 8 nights per trip (Praxis, 2009)
- The average Canadian RV owning household also camps an average of 29 nights per year (Praxis, 2009)
- Alberta RV owners made 1,046,768 RV trips in 2017 (Praxis, 2009)
- 40% of Albertans take part in overnight camping as a leisure activity (Praxis, 2009)
- 76% of those camping in provincial parks camp in RVs (Praxis, 2009)
- In 2008, half of AB RV owners did all of their camping in AB (Praxis, 2009)
Alberta Campground Statistics
How many campgrounds have you been to in Alberta? Many of us complain when a campsite is booked up for a weekend. With over 600 campgrounds in Alberta alone and 40,000 campsites, you can find a spot to camp somewhere in our beautiful province if you look hard enough!
Here are some awesome stats about the incredible campgrounds in Alberta and some of the great features they have for their guests.
- There are over 600 campgrounds and 40k campsites in AB (Praxis, 2009)
- 60% of Alberta campgrounds have playgrounds (Praxis, 2009)
- 53% of Alberta campgrounds have access to water-based activities (swimming, fishing, etc.) (Praxis, 2009)
Alberta RV Owner Camping Tendency Statistics
One of the great things about Alberta is that we are close to so many other cool locations outside of our wonderful province. Although we have plenty of beautiful campgrounds and campsites, some Albertan RV owners choose to adventure elsewhere.
Another interesting fact about RV campers in Alberta is that Fifth Wheel owners tend to spend more nights camping on average compared to owners of other RV body types. In our mind, as long as you’re out camping and having a good time, we’re happy! Here are some interesting stats about the camping tendencies RV owners in Alberta have:
- 9% of Alberta RV owners did all of their camping outside Alberta (Praxis, 2009)
- Fifth wheel owners in Alberta spent more nights camping with 33.9 nights on average (Praxis, 2009)
- Travel Trailer owners in Alberta spent 23.4 nights camping on average (Praxis, 2009)
- Motorhome owners in Alberta spent 26.1 nights camping on average (Praxis, 2009)
BC RVing Statistics
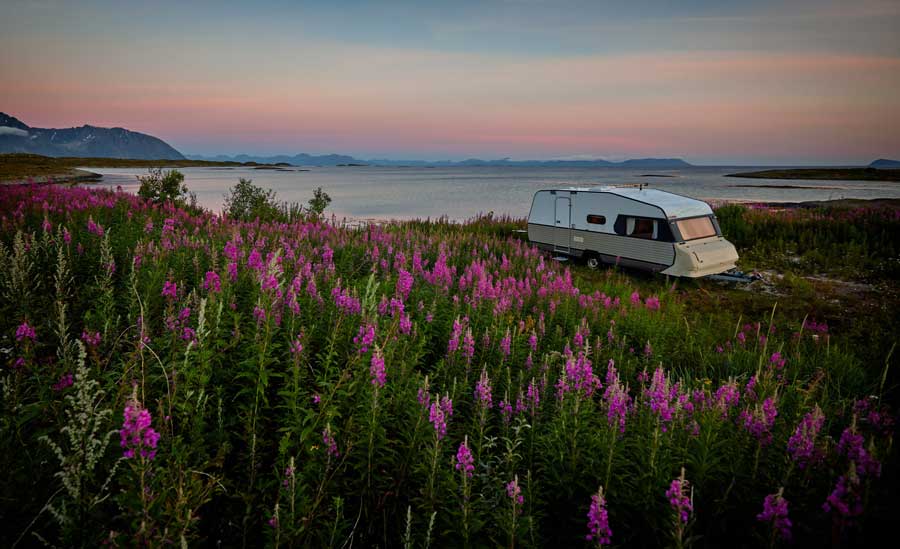
Because we have an incredible selection of RVs, we often get customers coming from BC to purchase an RV from us. Many campers in Alberta also take trips to BC with their RVs during the camping season as well. We thought you would appreciate some camping stats from our sister province as well!
BC RV Camping Frequency Statistics
Residents in BC love camping just as much as Albertans! Over three-quarters of BC residents are planning on taking a camping trip in the next two years. Even if they don’t camp yearly, BC residents do their best to get out camping every now and again.
Even if you’re not a dedicated camper, we love seeing people out camping. Here are some stats about how frequent BC campers get out camping:
- 28% of BC Residents have camped or RVed in the past two years (BC Government, 2018)
- 77% of BC Residents are likely to camp in the next two years (BC Government, 2018)
BC RV Camping Trip Statistics
In terms of the number of camping trips that BC residents take in a year, there is a pretty even distribution for how often they get out! It’s interesting to see that the largest proportion of campers camp 8-14 nights per year. That’s more camping than the Canadian average! With so many beautiful places to camp in BC, can you blame them? Here’s how much camping BC residents do annually by percentage:
- 18% of BC campers camped 1-3 nights (BC Government, 2018)
- 18% of BC campers camped 4-7 nights (BC Government, 2018)
- 20% of BC campers camped 8-14 nights (BC Government, 2018)
- 16% of BC campers camped 15-30 nights (BC Government, 2018)
- 18% of BC campers camped 31+ nights (BC Government, 2018)
BC RV Ownership Statistics
Interestingly, RV owners in BC seem to be pretty even in terms of those with towable RVs and those that are using motorhomes for their RV camping adventures. Here are some stats about what type of RVs BC residents are camping in:
- 24% of campers own a fifth wheel or travel trailer (BC Government, 2018)
- 24% of campers own a motorhome (BC Government, 2018)
RV Camping Expenditures
Although RV sales and travel account for a large proportion of RV expenditures, a fair amount of expenditures come from the cost of owning an RV in general. Things like storage, insurance, maintenance, and accessories make up a significant amount of RV related expenditures as well! Here are some stats about non-travel related RV expenditures:
- Equipment and accessories account for 23% of non-travel related RV expenditures (RVDA, 2018)
- Storage accounts for 13% of non-travel related RV expenditures (RVDA, 2018)
- Insurance accounts for 36% of non-travel related RV expenditures (RVDA, 2018)
- Maintenance accounts for 28% of non-travel related RV expenditures (RVDA, 2018)
RV Service Statistics
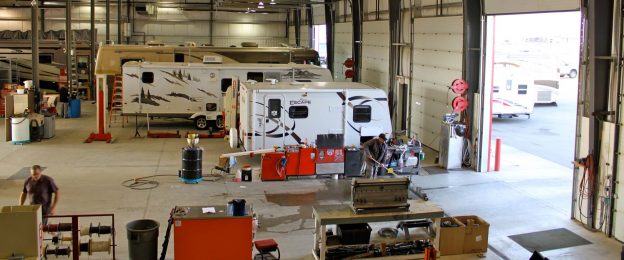
Maintenance is a big part of owning an RV. Although newer RVs come with warranties, every RV needs to be winterized, and parts will wear out as you own your RV. To give you an idea of what RV ownership could cost, we have rounded up some statistics on what RV ownership costs for some individuals.
RV Maintenance Statistics and Costs
RVs, motorized or towable, need to be maintained just like every other vehicle on the road! This is to ensure they are safe for the road and to keep everything working properly on the inside. Keep in mind, the more you use your RV, the more maintenance it will need. Although it costs money to maintain your RV, it’s better to spend the money on maintenance that could prevent a costly repair! To give you an idea of what the average RV owner should budget for maintenance, we’ve found some helpful rv maintenance statistics:
- Full time RVers can expect to spend an average of $100.00 per month in maintenance expenses (GoRollick, 2019)
- Annually, Full time RVers can expect to spend an average of $1200.00 in maintenance expenses (GoRollick, 2019)
- New Tires for your RV can cost up to $2500 (Axle Addict, 2019)
- Winterizing or de-winterizing an RV can cost anywhere from $100 – $200 on average (Bucars, 2020)
RV Repair Cost Statistics
As stated above, RV repairs can be expensive! Sometimes, even RVs that are meticulously maintained will need repairs and parts replaced in their lifetime. To give you an idea of what it can cost to replace various parts of your RV, we’ve found a helpful list of stats to outline the cost of some common repairs:
- Carpet replacement is $1700 (Axle Addict, 2019)
- The average cost of a transmission replacement is $2000 (Go Downsize, 2018)
- The average cost of a new refrigerator is roughly $3000 or more (Bucars, 2020)
- The average cost of a new towable RV axle is roughly $1000 or more (Bucars, 2020)
RV Lifestyle Statistics
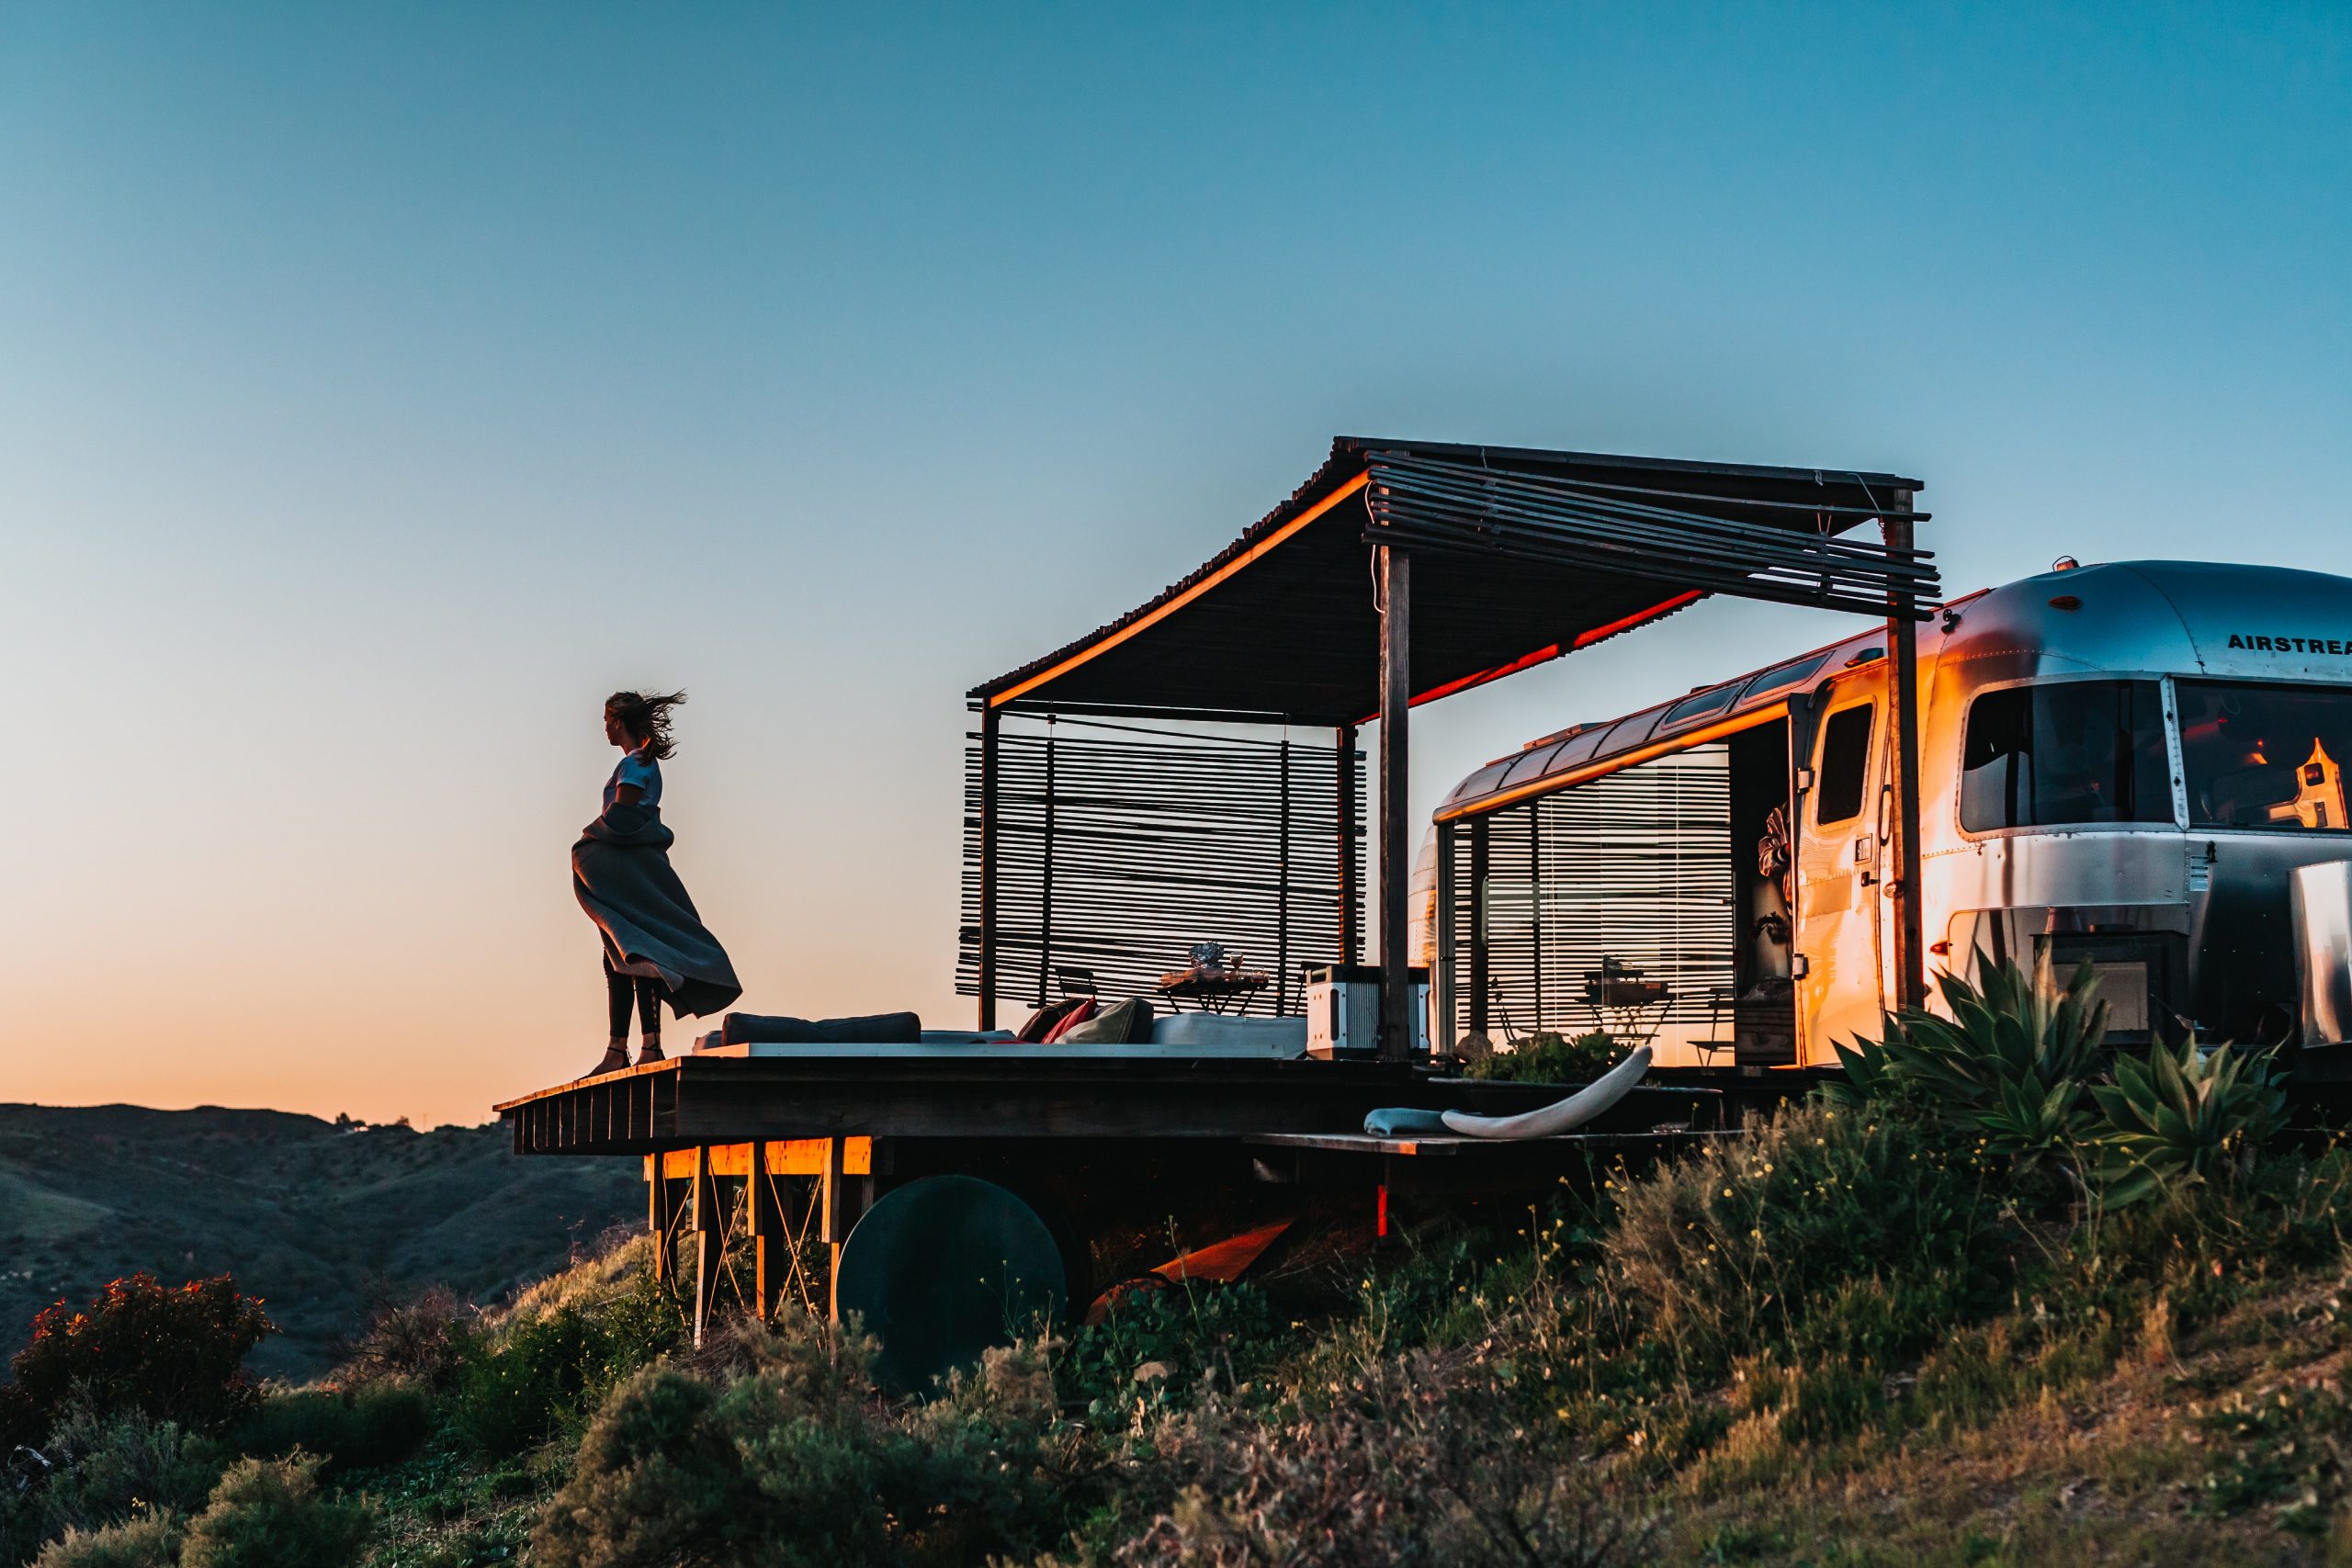
Are you looking to make the switch to being a full-time RVer? Living in an RV can be great, depending on your lifestyle! How great would it be to have home be wherever you park your RV? Although many want to live in an RV, some people do not realize what it costs to live in an RV full time. To give you an idea of what it costs to live in an RV compared to a regular home, we’ve come up with a list of statistics based on average full-time RV living expenses:
- Full-time RVers spend an average of $2170.29 on monthly expenses (Mobile Home Parts Store, 2016)
- Full-time RVers spend an average of $26,043.43 on yearly expenses (Mobile Home Parts Store, 2016)
- On average, full-time RVers should save up $39,600 before starting (Mobile Home Parts Store, 2016)
- About 54% of RV owners bring their pets with them when they travel (The Wandering RV, 2020)
- An RV Vacation is roughly 60% cheaper than taking a traditional vacation (The Wandering RV, 2020)
- Nearly a half-million RV owners use their RV as their primary residence (The Wandering RV, 2020)
RV Cost Statistics
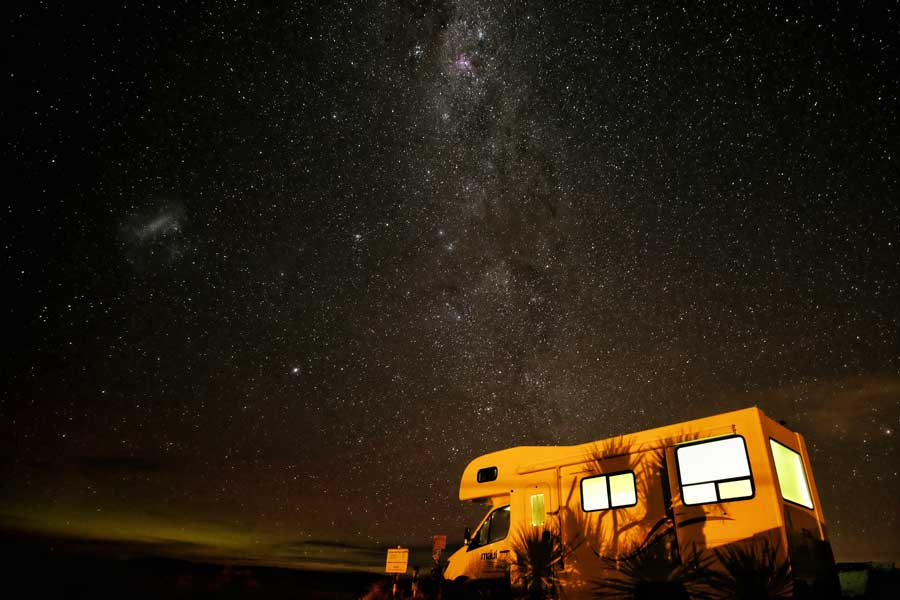
For those of you that are looking to purchase your first RV and are wondering how much they cost, we’ve found some interesting stats! We understand that purchasing a brand new RV may not be the right fit for everyone making their first foray into RV ownership, but here is a range of what you can expect to pay for different types of RVs. As you may have expected, there are some other inherent costs to RV ownership. Here are some RV cost statistics that outline what you can expect when purchasing your first RV:
- How much can you expect to spend on your first RV? (Bucars, 2020)
- Class A Diesel Motorhomes
- New: $350,000 – $1,000,000 +
- Used: $80,000 – $500,000 +
- Class A Gas Motorhomes
- New: $195,000 – $280,000 +
- Used: $50,000 – $150,000 +
- Class B Motorhomes
- New: $95,000 – $150,000 +
- Used: $40,000 – $100,000 +
- Class C Motorhomes
- New: $60,000 – $200,000
- Used: $12,000 – $80,000
- Fifth Wheel Trailers
- New: $50,000 – $160,000
- Used: $25,000 – $115,000
- Travel Trailers
- New: $20,000 – $100,000
- Used: $10,000 – $80,000
- Class A Diesel Motorhomes
RV Manufacturer Statistics
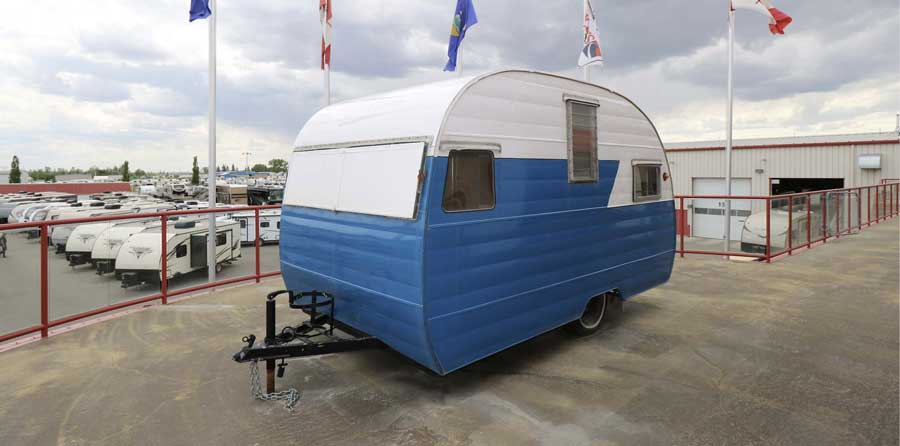
At Bucars RV, we are proud to carry RVs from some of the best manufacturers in the RV industry! We thought you might find it interesting to see how many RV manufacturers are out there in the world. Although there are over 100 RV manufacturers in North America, we are proud to sell RVs from Coachmen, Forest River, K-Z, Inc., Newmar, Tiffin Motorhomes, and Venture RV. If you want to know more about any of these awesome manufacturers, contact our sales team! Here is some info about the RV manufacturers out there and other related RV manufacturer statistics:
- There are more than 100 active RV manufacturers (The Wandering RV, 2020)
- 80% of the RVs being manufactured come from Indiana (The Wandering RV, 2020)
- Canada is the primary RV export destination for RV manufacturers. Over 90% of RV industry exports go to Canada yearly (The Wandering RV, 2020)
Pay a Visit to Bucars RV Dealership for All of Your RV Camping Needs
That’s a wrap! We hope you’ve found these statistics informative and helpful. These should help educate you a bit more about the world of camping and RVs, and give you enough information to make an educated decision about RVs and camping!
For all of your RV and camping related needs, take a trip to Bucars RV Dealership just north of Calgary. Our friendly RV experts will help you get whatever you’re looking for. Whether you are shopping for a new RV, are in need of service, or just some parts and accessories, our experts can help you find exactly what you’re looking for.
We’re here to help you make camping memories with your family that will last a lifetime and help you prepare for your next camping adventure. Let us show you why we are a refreshingly different RV dealership!


